Supplier Analytics: Covering All The Bases
Shipments and depletions are the backbone of any Beverage Alcohol sales analytics platform. While virtually all suppliers have their own unique way of viewing this information, it all boils down to how much product was sold at what frequency to what distributor and what is subsequently being done to get that product closer to the consumer. Here are some of the things suppliers typically do with this data:
-
Summarize it in a variety of ways across product line and sales hierarchies.
-
Roll it up up to larger geography and brand hierarchies, in some cases creating custom rollups of key product or distributor groupings.
-
Alter the volume numbers to reflect industry standards for that particular market segment – converting physical cases to 9L cases on the wine and spirits side, and converting physical cases to case equivalents on the beer side.
-
Painstakingly generate shipment and depletion goals to frequently measure against actual sales volumes and – depending on the adequacy of target attainment – either dig deeper to find poor performers and determine root cause, or dig deeper to find top performers and identify what’s driving increased sales.
-
Massage the data to determine what distributors are overstocked on certain products and what distributors don’t have enough products.
-
Try and project what future distributor inventory will be based on historical shipment and depletion patterns.
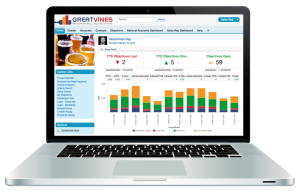
All of this data typically manifests itself in a myriad of summary and supporting detail reports that all bear a striking resemblance to this:

The data collection services provide summarized invoice sales from distributors to retailers. This data is generally known as ‘Retail Account Data (RAD)’ or ‘Sales to Retail (STR)’. Things get more interesting in this set of data because it affords the ability to view product sales more granularly, and by a variety of channel classifications. Sales are analyzed to determine the health of the national account business for instance, or to determine if the channel split between on- and off-premise is adequate. Sales are also analyzed by any of a slew of other attributes that are either associated with the data (store classification, sub channel etc.) or that can be derived by performing calculations on the data (accounts sold, points of distribution, velocity etc.).
In key markets, lists of ‘Key Accounts’ are often used to group and measure sales performance. Analysis is performed to determine gained and lost distribution, and account lists are generated providing insights on where one product(s) has been selling but another product(s) hasn’t. Depending on the data service provider, insights are also generated from distributor invoice sales dollars, and the currency of data is almost real time. The possibilities of slicing RAD and STR are virtually limitless. An example top-line RAD/STR report might look like this:

